Too many reports, hidden facts, time wasted on reports and information - these are the main difficulties that managers dealing with key decisions face every day. Is there a way to solve these problems?
The dynamic economic situation and the additional uncertainty associated with the COVID-19 pandemic mean that companies are currently undergoing many profound changes. The business models they use largely rely on data analysis, the volume of which increases from year to year. Faced with such a huge flood of information and reports, it is crucial to find a way to handle this data in order to streamline key business decision-making and facilitate ongoing operations. The solution that seems to address this problem may be an intelligent reporting system*.
An intelligent reporting system should at least partially eliminate the inconveniences associated with classic reporting. Therefore, to reduce data redundancy, the system must answer the question of what should actually be reported to increase data clarity. It should also choose the best data visualization method for each user and propose an optimal analysis path that guides them through the problem, rather than through facts that are currently less relevant. Finally, it is worth determining when reporting is necessary to minimize the frequency of alerts delivered to the necessary minimum. It may seem obvious, but how does the system know what should be reported? The key lies in three main assumptions:
Context analysis of the problem - the context is stored in the knowledge base.
Dependency analysis - related knowledge base.
Signal selection - signals (alerts) can be both threats and opportunities.
The essence of the intelligent reporting system is to check whether there are signals requiring reporting in the available data set. Signals can be both threats and opportunities. What will be interpreted as a signal depends on the knowledge base designer. The system can have any number of knowledge bases, which can operate independently or be interconnected, either conceptually (e.g., as a result of analysis, the system generates the need for in-depth analysis in a dedicated knowledge base) or through a common set of information they use (one piece of data may require analysis in two independent knowledge bases). Depending on the designer's intention, signals can be grouped and filtered, e.g., by their strength/importance. They can also serve as an output for further in-depth analysis.

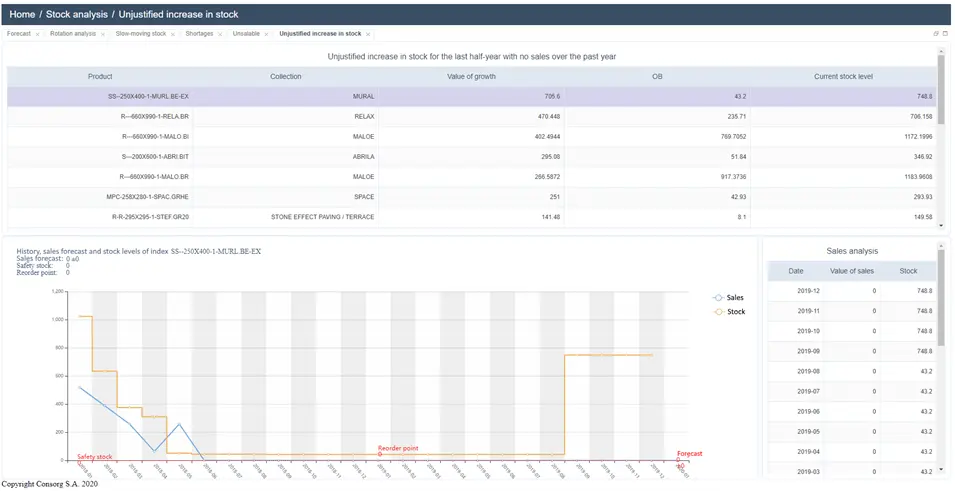
An example of the operation of a knowledge base dedicated to warehouse states: The system analyzes available data and selects those worth presenting to the user. The knowledge necessary for identifying problems is stored in knowledge bases as a set of business rules, which are processed using an open-source engine called Drools. Drools is a Business Rules Management System (BRMS) that provides a basic business rules engine (BRE), an application for creating web pages, and rule management (Drools Workbench). The business rules engine is expanded with connectors allowing data retrieval from independent sources such as databases, data warehouses, spreadsheets, etc., and allows extending the capabilities of the rules engine to process mathematical models or use artificial intelligence, e.g., fuzzy logic or machine learning systems. Self-service BI is one of the 5 most important BI trends in 2020, which is why during research, significant emphasis was placed on enabling users (designers) to create their own business rules. For this purpose, a dedicated business rule editor was created, where the designer can write rules in the original Drools format, in a text format similar to natural language, or graphically. In addition to business rules, the designer building the knowledge base has the option to develop visualization rules. This allows indicating to the system how specific data should be presented. The designer can limit their rules to individual signals or build entire management dashboards depending on the occurrence of specific groups of signals. Regardless of how much they want to influence the final shape of the report, they will never be able to predict the final set of signals generated from the knowledge base. In such cases, the system itself must ensure that the displayed data are reasonably clear to the recipient and, moreover, enable them to analyze both across identified problems and in-depth to understand the causes of the problem occurrence. When there are too many signals identified as those to be visualized to the user, the system will divide them into several smaller dashboards. When it encounters data that should be shown, and the designer has not specified their visualization method, it will use internal rules to automatically generate data, e.g., when visualizing a time series, it will use a line chart. Additionally, the system attempts to select visualization based on the user's profile. The same data can be presented to 2 different users in different ways. Intelligent reporting can be done in a mode similar to classic reporting, i.e., it is triggered by the user. It is the user who expresses the desire to explore a given area (1 knowledge base or groups of related knowledge bases) or general information about current issues - triggering all available analyzes. Reporting can also be done continuously. In the latter case, due to the solution's efficiency, it cannot be performed on all available data sources but is most often connected to a data stream, e.g., a transactional system, and observes emerging records to catch abnormalities online. In such cases, reporting may be limited to sending short messages to the user (via email, messengers, etc.), and only by expressing interest in the matter will the user initiate detailed reporting.
*The solution is the result of the research and development project entitled "Development of advanced, intelligent algorithms for contextual selection of reported content and methods of its visualization", conducted by CONSORG and co-financed by the European Union as part of the Regional Operational Programme for the years 2014-2020.
**Top Business Intelligence Trends Article is a summary of a workshop conducted by the President of CONSORG SA, Marian Szary, as part of the IFIP 2020 conference


